What’s New on Robinhood

Candlestick charts, discovery tools, and more
Over the past few months, we’ve been working on a number of new features to make Robinhood even better. Here are the latest additions to the platform:
Introducing Candlestick Charts
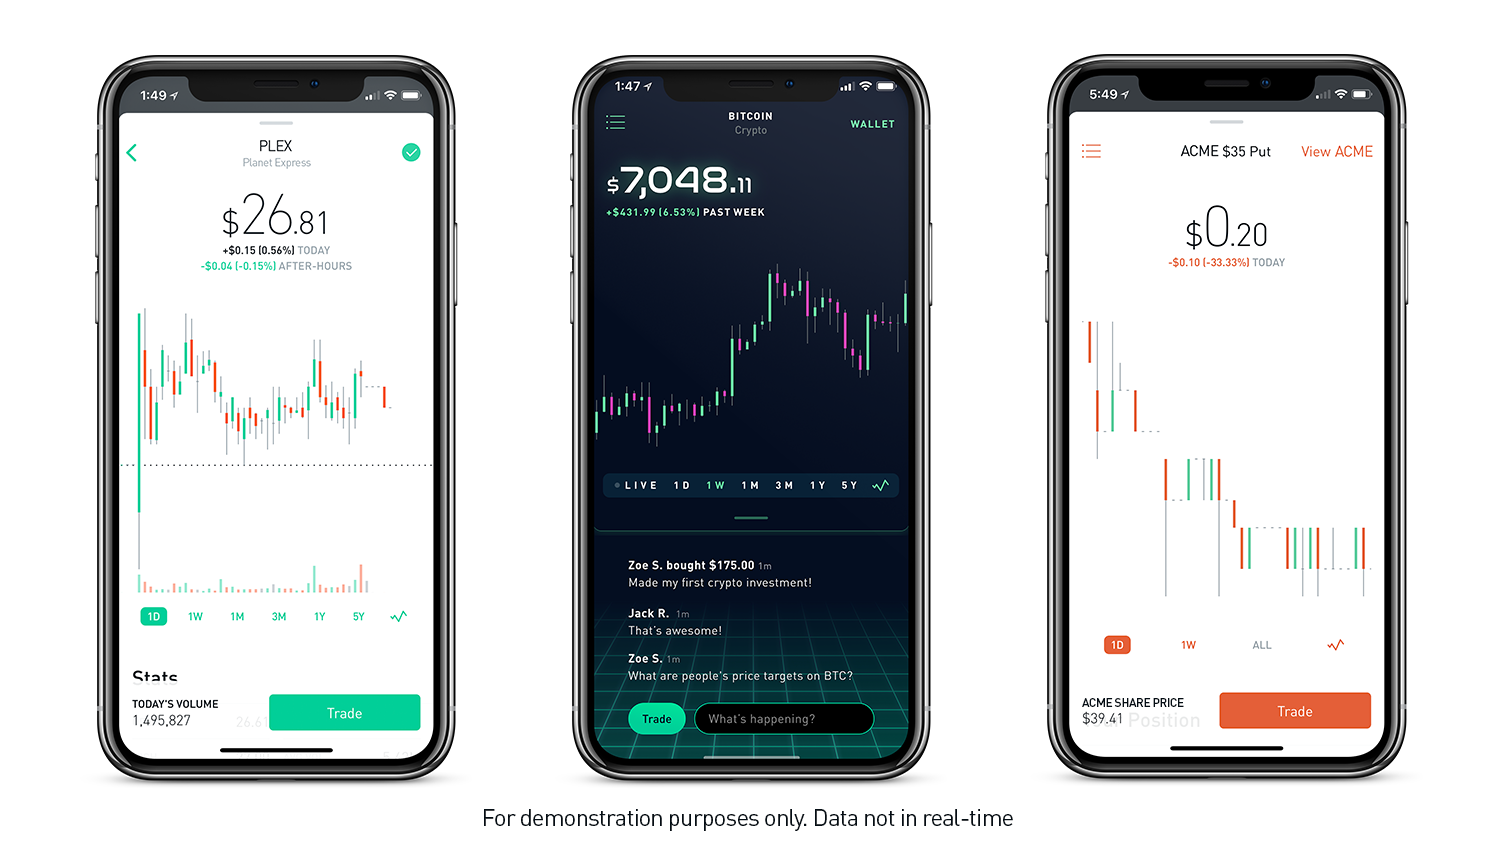
We’ve received daily requests to add candlestick charts to Robinhood, and over the next few weeks, we’ll be bringing them to the stock, options, and cryptocurrency pages on mobile.

Candlestick charts help investors better understand how prices move. While a line chart shows you only the close price, each candlestick shows you four pieces of information: the open, high, low, and close price during a certain time period.
To view candlestick charts, tap the candlestick icon on the bottom right corner of any stock, options, or cryptocurrency chart. Learn more here.
More Research & Discovery Tools
To help you make better-informed investment decisions, we’re bringing some of your favorite web features to mobile, including:
- Analyst Ratings: Read commentary and view the buy, hold, and sell ratings from Wall Street analysts.
- People Also Bought: Discover other stocks investors bought on Robinhood, including competitors, suppliers, and more.
- About: Find quick facts about stocks, such as the company’s CEO, its founding date, and where it’s headquartered.
Explore: More Information at a Glance
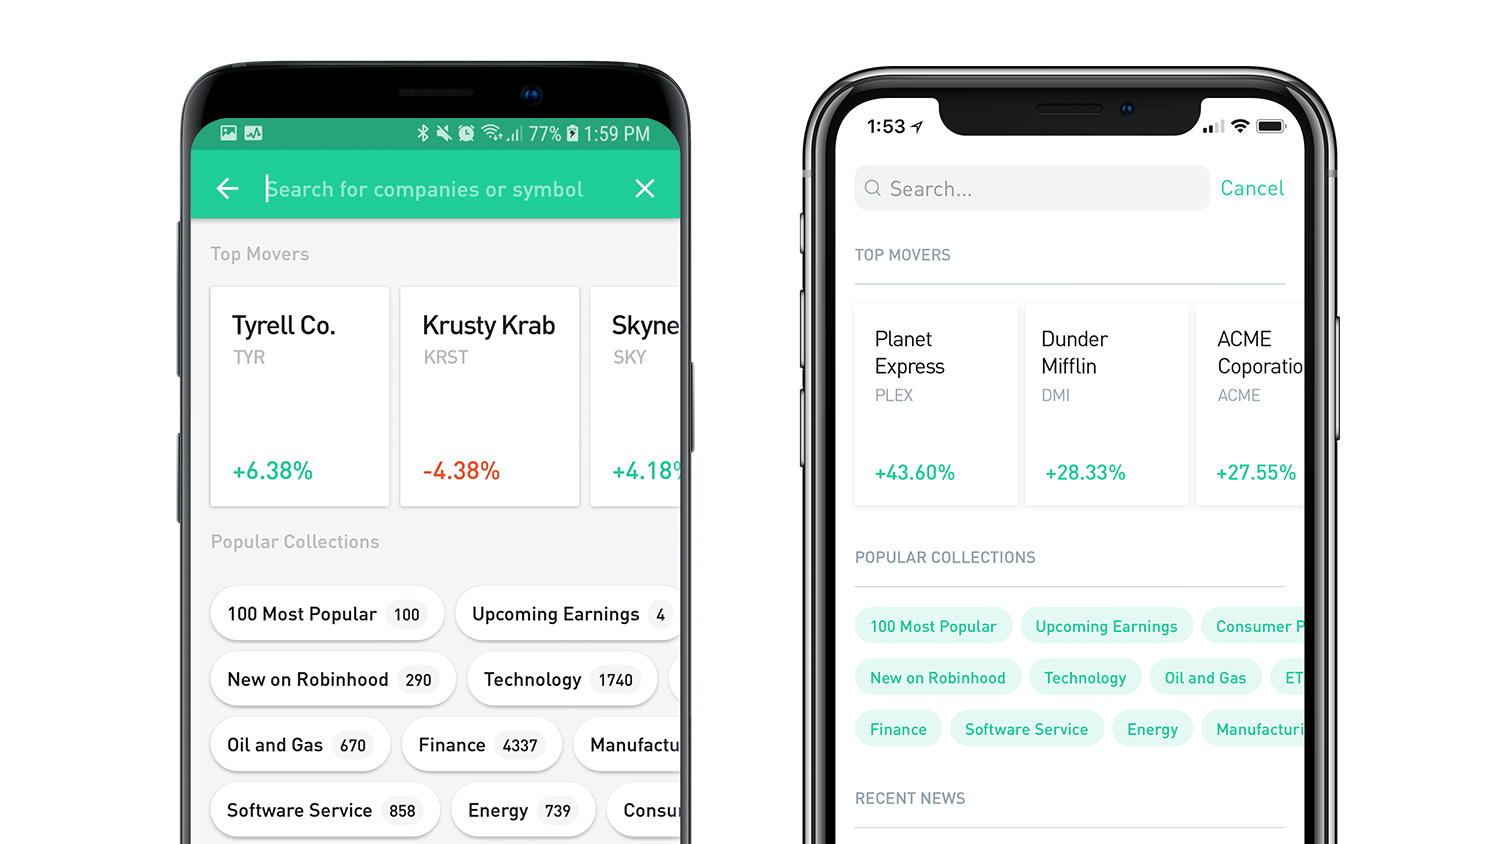
Now you can see top movers, popular Collections, and recent news when you tap the search icon in the upper right corner of the app.

Options, Now on Web
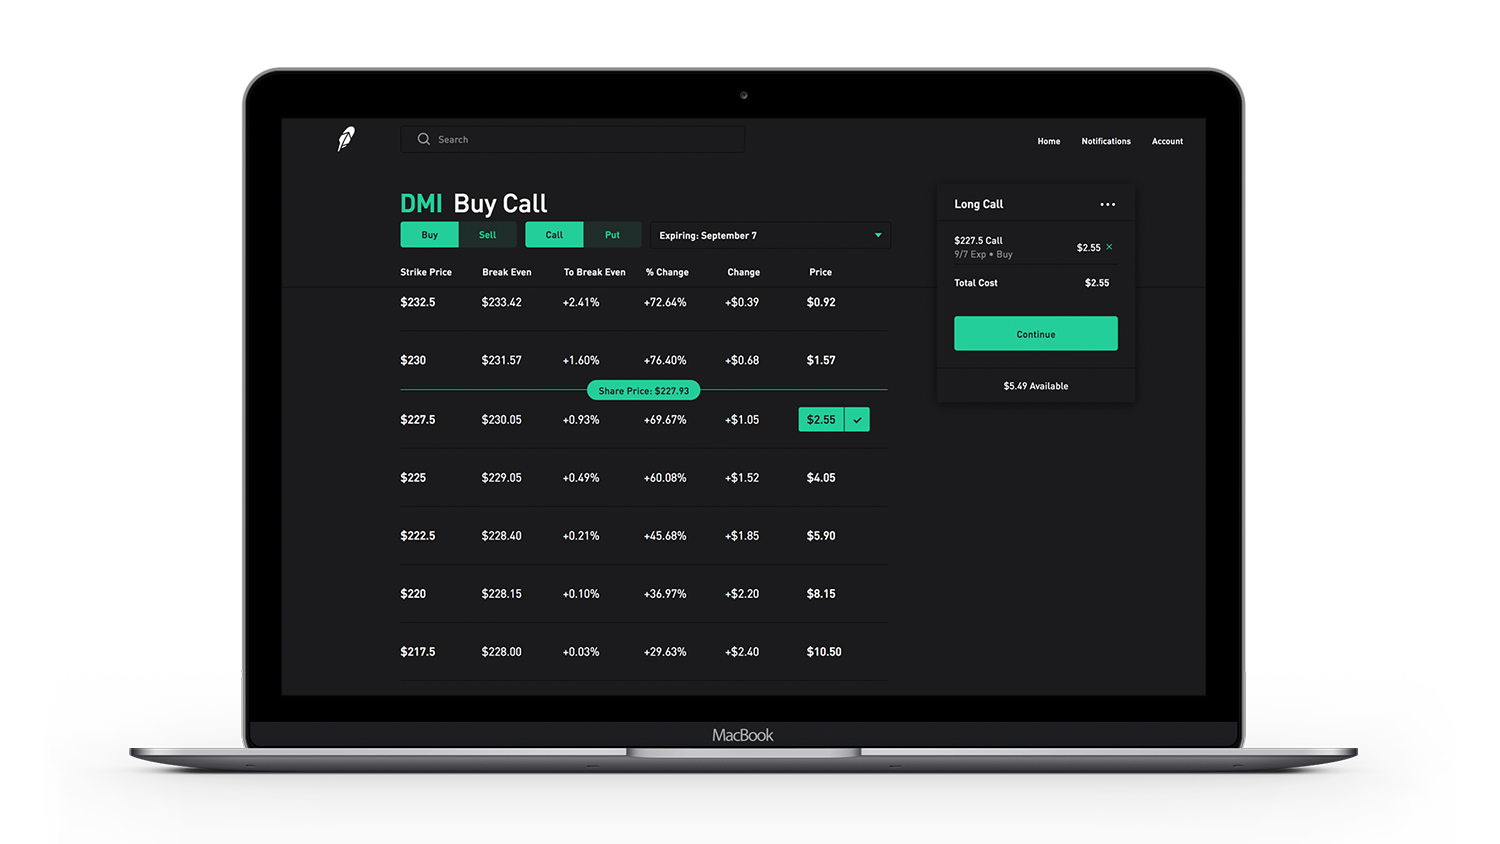
We’re bringing all options features available on mobile to web. Now you can open, close, and monitor your options positions, as well as sign up to trade options, on web.

In case you missed it, we’re also adding over 250 global stocks to Robinhood, and recently launched free extended market hours for everyone. We hope you enjoy these updates – look out for more features in the coming months!


