Case Studies in Kubernetes Controller Limits
Case Studies in Kubernetes Controller Limits
Preventing Controller Sprawl From Taking Down Your Cluster
Authors Madhusudan C.S., and Ikai Lan work on Infrastructure Engineering at Robinhood
Here at Robinhood, we like Kubernetes a lot. We like using open source technologies because it lets us tap into the global community of smart builders to see how others think about problems that we all share. Besides being battle-tested by many other organizations, another reason we like Kubernetes is how easy it is to extend when we need to. By exposing an interface via the API server that is amicable to both humans and programs, Kubernetes makes thinking about extensibility second nature.
One of the foundational patterns of Kubernetes is the concept of a controller. Almost everything that runs inside Kubernetes follows this pattern, and it’s also how teams can extend Kubernetes to their liking. Using asynchronicity, incremental updates and effective cache management, the controller pattern lets teams build locally against the API server and have confidence in the scalability of their extensions. This ease of use comes as a double-edged sword: it’s easy to overlook the fundamentals of how controllers work, overbuild, and end up in a number of different corner states that cause the fundamental assumptions for the pattern to break down. In this blog post, we’ll do a quick review of what we mean when we talk about Kubernetes controllers, how the machinery underneath the hood works, and cover two short case studies of when we ended up pushing the limits just a little too far.
A brief overview of controllers
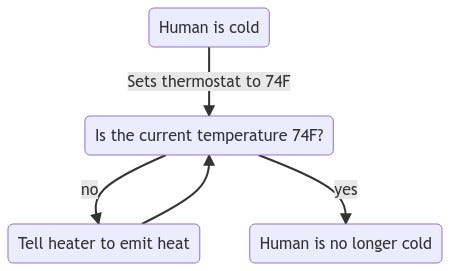
When we say “controller”, what exactly do we mean? A controller is a never-ending loop that “knows” about some desired state of the world, then observes the current state of the world and makes changes as needed to update resources within its realm of responsibility until they match the desired state.
It’s helpful to think of a thermostat, which is also the example used in the Kubernetes documentation on controllers. A thermostat is a controller that reads the temperature set by the user (the desired state), and tries to heat or cool the surrounding space to bring its temperature (the current state), to the value set by the user.
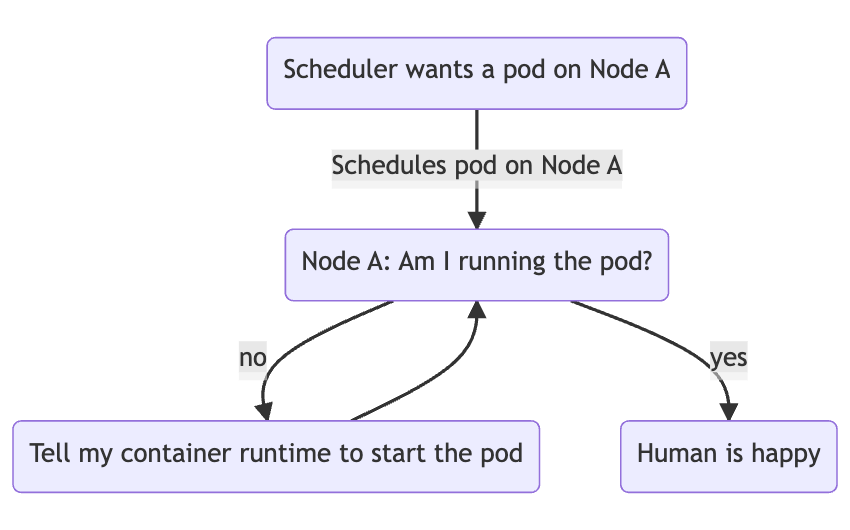
Similarly, kubelet, the node agent running on each Kubernetes node and responsible for managing pods on the nodes, watches the API server to see if the kube-scheduler has assigned pods to the node under management by the kubelet instance. If the pod isn’t already running, it starts the pod on the node by asking the local container runtime to start the containers that belong to the scheduled pod.
We can spend all day talking about controllers, but hopefully this guide provides just enough background for most people to understand the case studies covered by this post. To go into more depth, the best place to start is the official Kubernetes documentation on the topic.
CRDs, the perfect sidekicks for controllers
Controllers are already very powerful, but if they were limited to operating on built-in types, there’s only so much fun you can have with them. Enter: the CustomResourceDefinition.
Often known as CRDs for short, a CRD, or, CustomResourceDefinition, is a mechanism by which Kubernetes allows its users to define their typed resources for controllers to operate against. A CRD by itself does nothing; they are most typically used as data entities for controllers that implement the custom logic for their APIs. Paired with controllers, a CRD now allows Kubernetes users to build almost any kind of stateful custom logic they want.
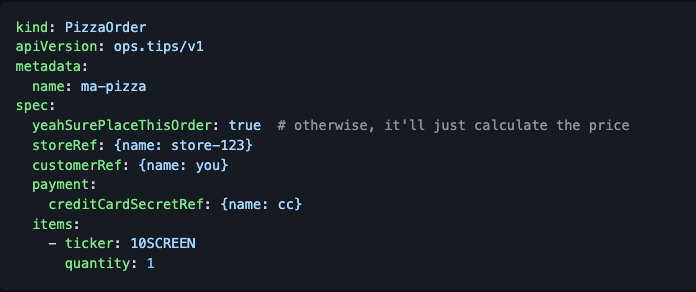
One of our favorite controller examples (that we don’t run) is the pizza-controller open source project. The pizza-controller watches the API server on changes to a number of CRDs representing pizza stores and pizza order resources, then “reconciles” the desired state of the world when a new order resource is created by making API calls against a real online pizza delivery API.
Take a look at the example resources instances below from the official README:
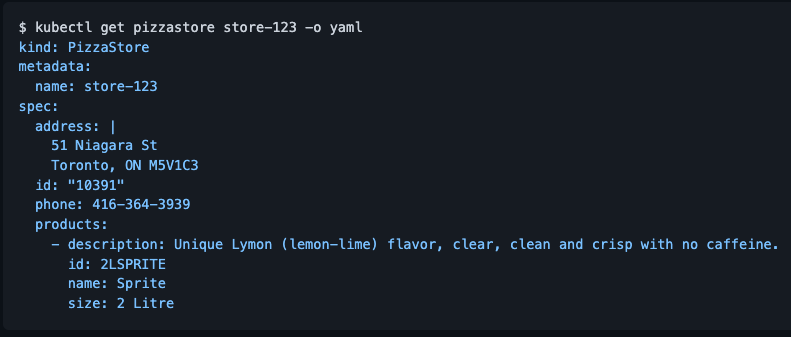
Someone who has access to the cluster can then create a new PizzaOrder resource using kubectl:
To make things even more interesting: a custom resource can be used by any controller running in the same cluster, because CRDs are not tightly coupled with controllers at all.
For example, taking the Pizza CRD further, one could conceive a Kubernetes cluster where the cluster owners offer a complimentary pizza for every new Kubernetes ServiceAccount as a welcome swag. This would be implemented as a controller that watches for ServiceAccount objects, a Kubernetes-native API that comes built-in with all standard Kubernetes clusters, and creates a PizzaOrder custom resource for each new ServiceAccount it observes.
All these capabilities provide a powerful extensibility model. And as cliche as it may sound, with great power comes great responsibility.
Case study #1: A duel between controllers
Our first case study concerns an issue discovered while I was oncall a few months ago. I got an alert about a problem where our deploy Jobs were failing to run. Upon initial examination, it looked like they were failing to connect to the AWS Instance Metadata Service (IMDS) 169.254.169.254.
Accessing AWS IMDS is one of the very first things most of our pods do when they come up to learn more about their environment and themselves. Our first intuition was that there was a problem with IMDS and started investigating that. As we started digging into some of our nodes, I got paged again. This time CronJobs were unable to resolve DNS.
The timing was incredibly suspect — these two problems must have been related. What wasn’t clear to me, or anyone else on the response team was the relationship between the two issues. What could cause an IMDS failure, but also cause DNS failures for CronJobs?
It became apparent that the problem was not CronJobs or DNS specifically, but any new pod starting up would be unable to establish network connections — a DNS query just happened to be one of the first operations taken up by any pod. Pods would experience total network blackouts for the first few minutes — sometimes as short as 2 minutes and as long as 10 minutes. Since jobs created new pods every time they needed to run their defined actions, that was simply the most common workload which would report high error rates.
Further muddying our data — running pods continued to work. In that regard, this took some pressure off us because we had plenty of capacity to serve customer traffic, and therefore there was no immediate customer impact.
A brief interlude: Network Segmentation via Calico
We built an in-house solution that provides a uniform way to enable communication between the vast majority of our software that runs on Kubernetes and a small portion of our legacy software that still directly runs on EC2 VMs on top of the open source Calico project. It integrates with security groups, a primary mechanism to enforce network segmentation in the AWS world. It also allows federated network policies across Kubernetes clusters.
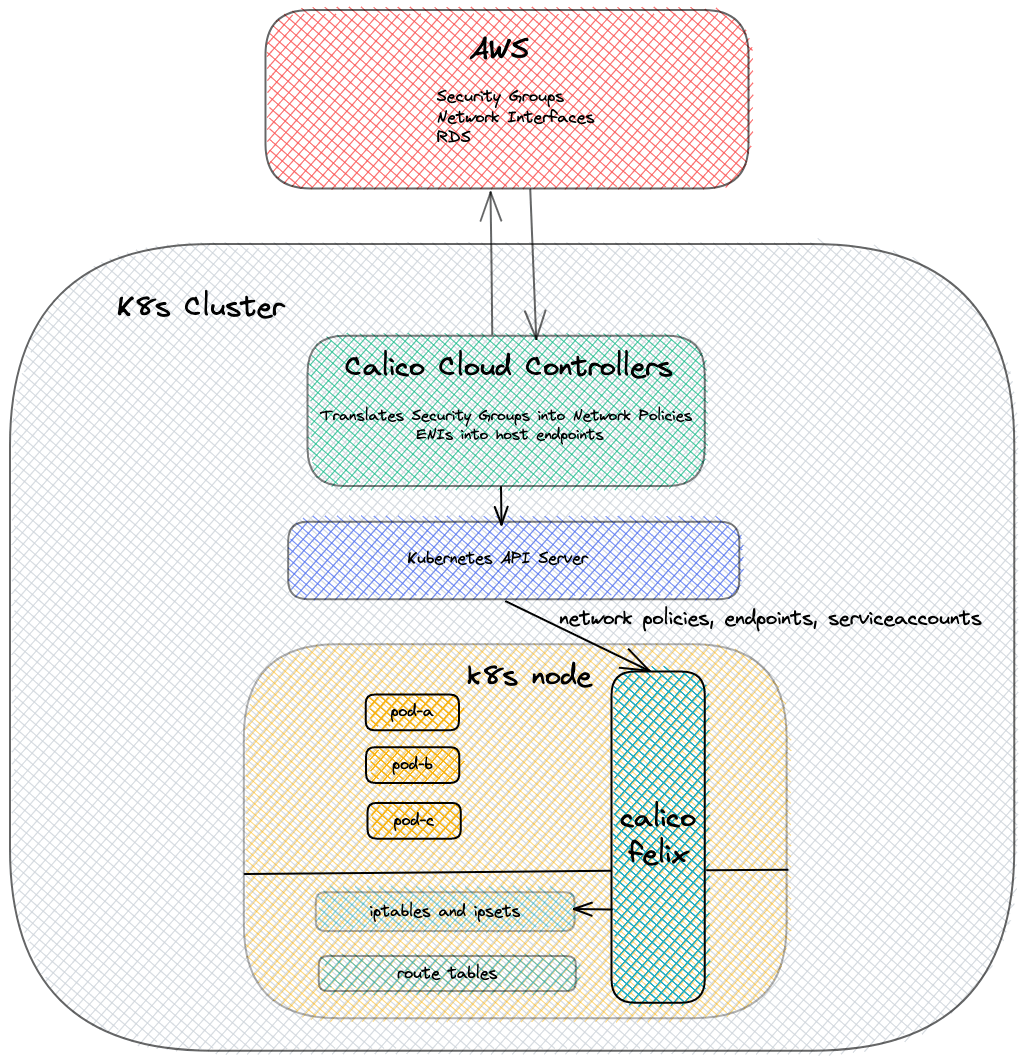
A controller that’s part of this stack periodically reads in the security groups and network interfaces from AWS and programs network policies. These policies are then read by Calico node agents, Felix, another controller, to program iptables rules to allow pods to talk to other pods and EC2 VMs.
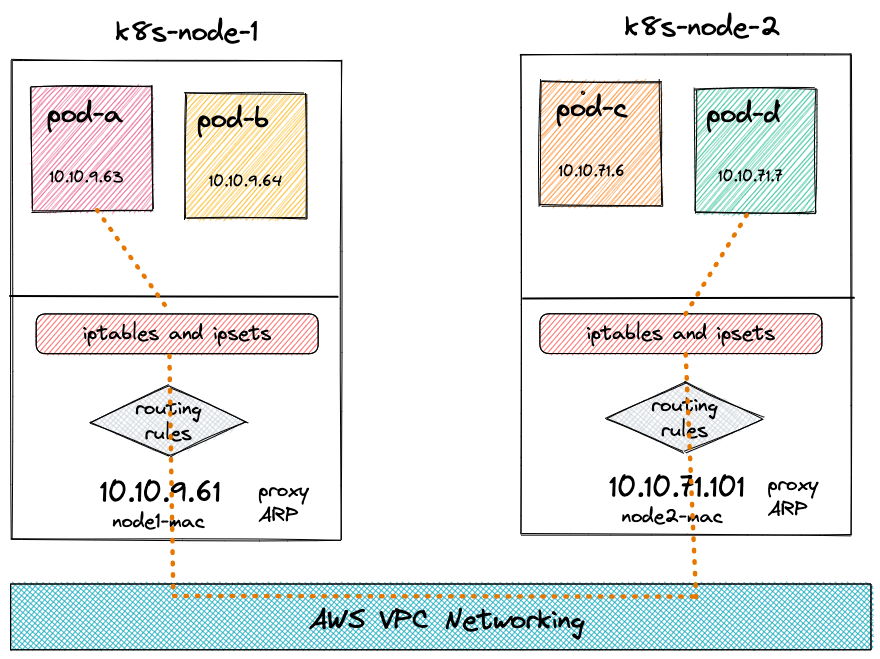
When a pod starts running on a node, AWS k8s CNI (link) assigns an IP address from the pool of address it has acquired from the VPC, assigns it to the node and sets up routing rules to allow the traffic to flow in and out of those pods.
The following diagram illustrates how pod-a is set up to talk to pod-d on a different node.
Sleuthing continues …
While sifting through our logs for networking components, we noticed the log lines that looked like this:
`Syncing routes: removing old routes`
They came from Felix. Calico was removing the routes for the pods! If Calico was removing the routes, then who was adding them in the first place? It was the AWS k8s CNI, as expected. It is the AWS k8s CNI’s responsibility to set up routing rules for the pods, remember?
Calico would remove these routes right after the AWS k8s CNI process added them. This was causing a total network blackout for these new pods as they came up. There was a tiny window when the routing rules would be available, but it was such a short window that it did not matter in practice. Calico would add the routing rules a few minutes (2–10 minutes) later and everything would start working again for these pods. Eventual consistency at its best, right?
Unfortunately not — for most of the long running pods, this 2–10 minutes was beyond their readiness probe timeout windows. Therefore, these pods got killed before they gained network connectivity.
We implemented some short term mitigations to ensure we could continue serving our customers should a scaling event were to happen and went on a root causing expedition.
The root cause
Calico uses an intermediate cache and a connection pooler called Typha to reduce the load on the Kubernetes API server. We had already noticed a significant jump in its ping latencies that correlated with the time of the first alert. These latencies were the amount of time it took Typha to ping Felix. We had noticed a significant jump in the connections that Typha was dropping. These were Typha’s connections to Felix.
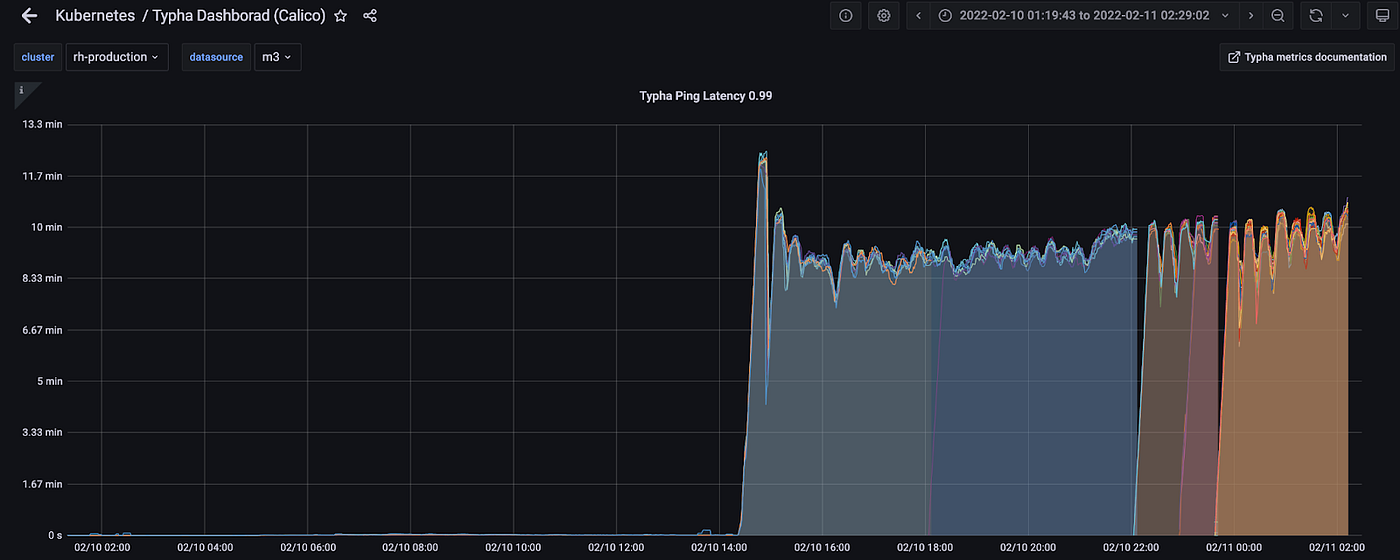
All these pointed to Calico being unable to keep up. We were not sure what was causing it because we had handled significantly higher loads than we were seeing that day. There wasn’t an increase in the pod churn rate or the security group change rate.
We noticed that there was a sharp increase in the number of PATCH calls that were being made to the Kubernetes ServiceAccounts API. This sharp increase correlated with the time of the first alert as well and this was our clear smoking gun!
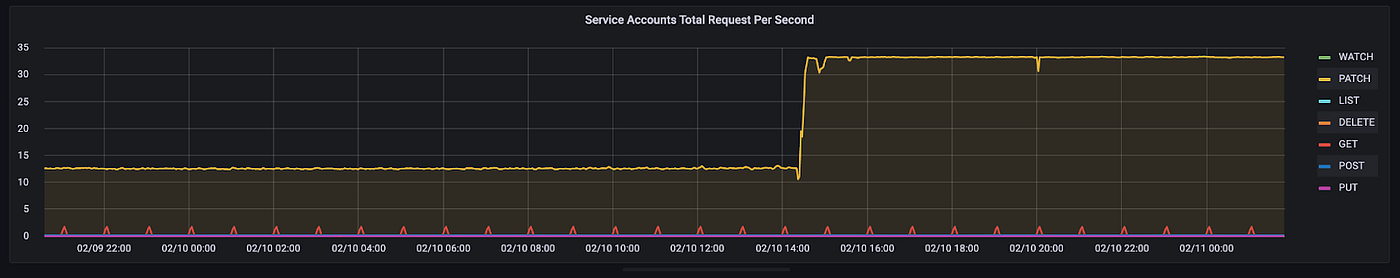
Working with oncalls from various partner teams, we looked at the audit logs. We learned that there was a change introduced to our in-house service development framework called Archetype. A change was made to the Archetype controller to add annotations to the ServiceAccount objects to indicate the component that owned the ServiceAccount. The annotation contained a computed signature of the owner component. At the time, more than one Archetype component of a given service could share a single ServiceAccount.
This led to the controller for these components “fighting” over the ownership of these ServiceAccounts, generating a large number of unending ServiceAccount update operations.
Kubernetes and Calico support ServiceAccount-based network policies which is why Calico watches for mutations to ServiceAccounts. Felix also maintains a network graph consisting of pods, IPs and the ServiceAccounts associated with the pods. Each update to a ServiceAccount requires a recomputation of this graph.
When the number of mutations to the ServiceAccount objects are low, which is generally the case in the steady state, everything works as expected. But when the mutation rate became very high, Felix’s in-memory worker queue (controller queue) became backed up processing these updates and that caused the most important updates — new pod creation — to not be processed for minutes.
Felix has a code path for managing routing rules for pods. But when a separate CNI plugin is used that code path should be disabled, via configuration, disallowing Felix from managing any routes at all on the nodes. While we had configured Felix to disable routing, a bug in Felix made our configuration ineffective and enabled Felix to manage routes.
Felix, not knowing about the new pods due to starvation, went ahead and deleted the routes added by AWS k8s CNI as it did not recognize those routes. It would eventually catch up, several minutes later, learning about those new pods and adding the routes back!
Case study #2: Caches all the way down!
The second case study follows a big scale down of our services following a production freeze. During the thaw, we started noticing that Kubernetes API servers started dying. One or more API server replicas would die, come back up, stay healthy for a bit and serve traffic and die again. We were losing the control planes of our clusters and that made things nearly impossible to debug. We all depend so much on kubectl to debug our clusters, don’t we? And kubectl just talks to the API server which in this case wasn’t healthy.
Fortunately, we only seemed to impact one cluster’s control plane nodes at a time, leaving the control planes of all our other clusters functioning. With Kubernetes, workloads running in the data plane are designed to keep running even in the event of control plane outage. Earlier in the year, we required all applications to be homed in multiple clusters — so even in the event the data plane was impacted, no customer experienced any impact.
When we looked at the API server metrics, we saw that our resource usage was through the roof!

In the fog of incident response, our response team came up with a number of theories. Some examples of the hypotheses we invalidated:
- Audit logging: We were seeing audit logs getting buffered and backed up in the API server logs. We were also seeing errors that looked as follows:
Error in audit plugin ‘buffered’ affecting 1 audit events: audit buffer queue blocked…
in the API server logs. This initially led us to believe that inefficient audit log webhook sink coupled with the lack of circuit breaking logic was leading to memory bloat of the API server processes eventually OOM killing them.
- Excessive use of large ConfigMap mounting by pods. We thought this could be overloading the API server as kubelet watches on these ConfigMaps and Secrets individually per resource as opposed to using bulk watches for other resource types in other controllers.
We increased the size of the control plane nodes, i.e. moved our control plane including the API servers to larger VMs. This made the problem less severe, but did not completely eliminate it.
None of these theories were corroborated by evidence in all the clusters we saw the problem.
After carefully looking at all the changes that had gone into the cluster, we started noticing that increased API server resource usage correlated with either new deployments of large applications or a large load test.
At the same time, we also noticed a large number of HTTP 410 errors in the API server logs. Kubernetes has documented this status code well.
When the requested watch operations fail because the historical version of that resource is not available, clients must handle the case by recognizing the status code 410 Gone, clearing their local cache, performing a new get or list operation, and starting the watch from the resourceVersion that was returned.
Suspicious!
Interlude: (Re-)introduction to controller semantics
A controller does an expensive list call at startup to get the snapshot of the current state for all the resources it is interested in and set up watch from that point. This allows the controller to take action, if any, at the snapshotted state and then take actions for every change to the object without missing any updates to the resources after the snapshotted state.
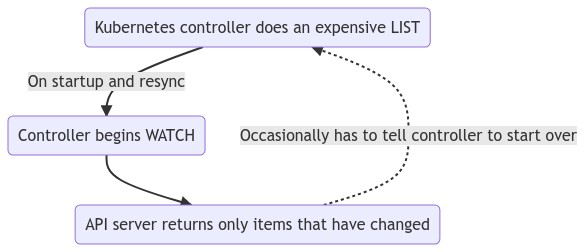
When the watch operation fails for any reason, this contract is broken because it can lose watch events of the changes made to the resources in the duration the watch was broken. The controller has to restart the entire process running the LIST operation again to snapshot the latest state and establish a watch again from that point.
The root cause
Once we saw a large number of 410 Gone messages in our logs, it became clear that clients were having hard time maintaining their watch connections and were attempting to reestablish them by doing a relist followed by a watch. We saw evidence of all these. Further examination revealed that it was kubelets that were struggling to maintain their watch on pods and were constantly attempting to LIST followed by a WATCH.
Looking at the service rollouts and the load tests that were running, it became apparent that the beginning of these large scale 410 Gone errors correlated with rollouts of large services or large load tests. Because we were exiting a production freeze, we were seeing an unusually high activity of such rollouts or tests. These activities created, updated or deleted pods at such a high rate (order of thousands of pods in a matter of minutes) that this caused Kubernetes API server’s watch cache to go stale quickly.
In essence, this led to the API server removing historical versions of pods from the cache at such a high rate that kubelets could not keep up. This caused the API server to send 410 Gone errors to kubelets, in-turn causing them to perform expensive LIST operations, overwhelming the API servers and sending the API server instances into a downward spiral leading to an eventual crash.
Lessons learned
Observability, observability, observability!
You can’t fix what you can’t see. Having a good observability posture is the key to operational success. But what does it mean concretely in the context of Kubernetes control plane?
Metrics
Kubernetes components including the API server, controller manager, etc. export a ton of useful metrics. Scrape them all. You never know what you need until you need it.
That said, it’s not practical to build dashboards for every single one of those metrics. Because there are so many, having them all in the dashboard is distracting. Invest time in understanding what matters and what doesn’t for day-to-day operations. Structure your dashboards in such a way that your key metrics are easily accessible.
Though your dashboards don’t contain all the metrics you are scraping, have the ability to build ad-hoc graphs when you need them. Unexpected situations need unexpected metrics.
Further, ensure that controllers you are writing export all useful metrics as well. It’s not just you, but ensure all your partner teams are following these best practices when writing controllers as well. If possible, build a framework for authoring controllers that export all the standard metrics automatically.
Logs
Logs from most Kubernetes components such as kube-controller-manager, kubelet are useful. Reading and understanding logs of software you did not author is a skill. Train and level up your teams so that they find relevant information in these logs fast when the system experiences problems.
Kubernetes API server logs are high volume and most of the time feel noisy. Other than a few exceptions, we generally haven’t found these logs to be useful. These logs seem to be more geared towards the people who are developing the API server as opposed to the people who use the API server.
Having all the logs from Kubernetes system components, including syslogs, exported to a centralized logging service that allows you to query and filter these logs in a UI is very handy. Ensure that your team is well trained to use this logs querying and filtering system as well.
Build dashboards for easily accessing useful logs, if your logging service supports it. Share useful queries with your team. For example, we have queries to access kubelet logs and other syslogs shared with the team.
If you build a framework for writing controllers as discussed in the metrics section, ensure that you include standard logs at the framework level too.
Audit Logs
The gaps in the API server logs are generally filled by the audit logs that the API server generates. Like ordinary logs, have the ability to query and filter these logs as well. And again like ordinary logs, have the entire team trained and have shared dashboards, queries, etc.
Audit logs don’t just help with security monitoring, but we have found it to be a very powerful debugging tool. Data about the source of the calls, the frequency and at what times. We have used audit logs to understand the API request patterns during both the incidents described above. For the first networking incident, we were able to identify patterns in service account operations. For the second incident, we determined the pod list and watch rates using audit logs.
Change visibility
Have visibility into changes that are pushed to cluster components, including extensions built by your and your partner teams.
Pushing changes to the cluster components via a CD system is the most basic best practice you can inculcate. On top of that, have a simple system or tool that can quickly show you the changes made to your clusters. For example, you can post notifications of the summary of changes rolled out to cluster components to a Slack channel dedicated for such notifications. Then during incidents, you can quickly refer to all those changes and revert them as your first mitigation step.
Overall, have the ability to quickly construct the timeline of changes that have gone into your clusters.
Kubernetes’ extensibility model enables anybody to build extensions, work with all your partner teams when they build these extensions. It’s easy for first time writers of controllers to roll out controllers that too aggressively directly read from the API server instead of an in-memory informer, for instance. Ensure that they are integrated into your change management and tracking system as well.
Read the code
Kubernetes is a large code base and has a large surface area. Most real world deployments also use tons of extensions built by the vast ecosystem. Not everybody on your team will be able to become an expert in everything.
Identify the most important areas for you and build expertise for each of those areas within the team. For example, networking could be one of those areas, container/pod lifecycle, kubelets and node management could be another area and so on. Encourage the experts of a given area to familiarize themselves with the code of the components in their area.
Experts should also become comfortable with the debugging tools in their area. For example, networking experts should be comfortable using tcpdump, ip, dig, etc. during networking incidents. Because most, if not all, Kubernetes components and extensions are written in Go, your entire team should be familiar with using pprof for Go, interpreting call graphs and flamegraphs, etc.
Conclusion
Kubernetes is a highly extensible and a powerful system that delivers value by solving a number of problems associated with operating large distributed systems at scale. Like every powerful tool, it needs to be used responsibly and with care to ensure it doesn’t adversely impact your products. We learned a lot operating Kubernetes at scale — we hope our case studies will help you and your teams better understand how to effectively operate, extend and debug yours.
If you’re interested in solving problems similar to the ones outlined in this blog post, we’d love to hear from you! Check out our current open roles in Engineering via our careers page.
Robinhood Markets Inc. and Medium are separate and unique companies and are not responsible for one another’s views or services.
All trademarks, logos and brands are the property of their respective owners.
© 2022 Robinhood Markets, Inc.