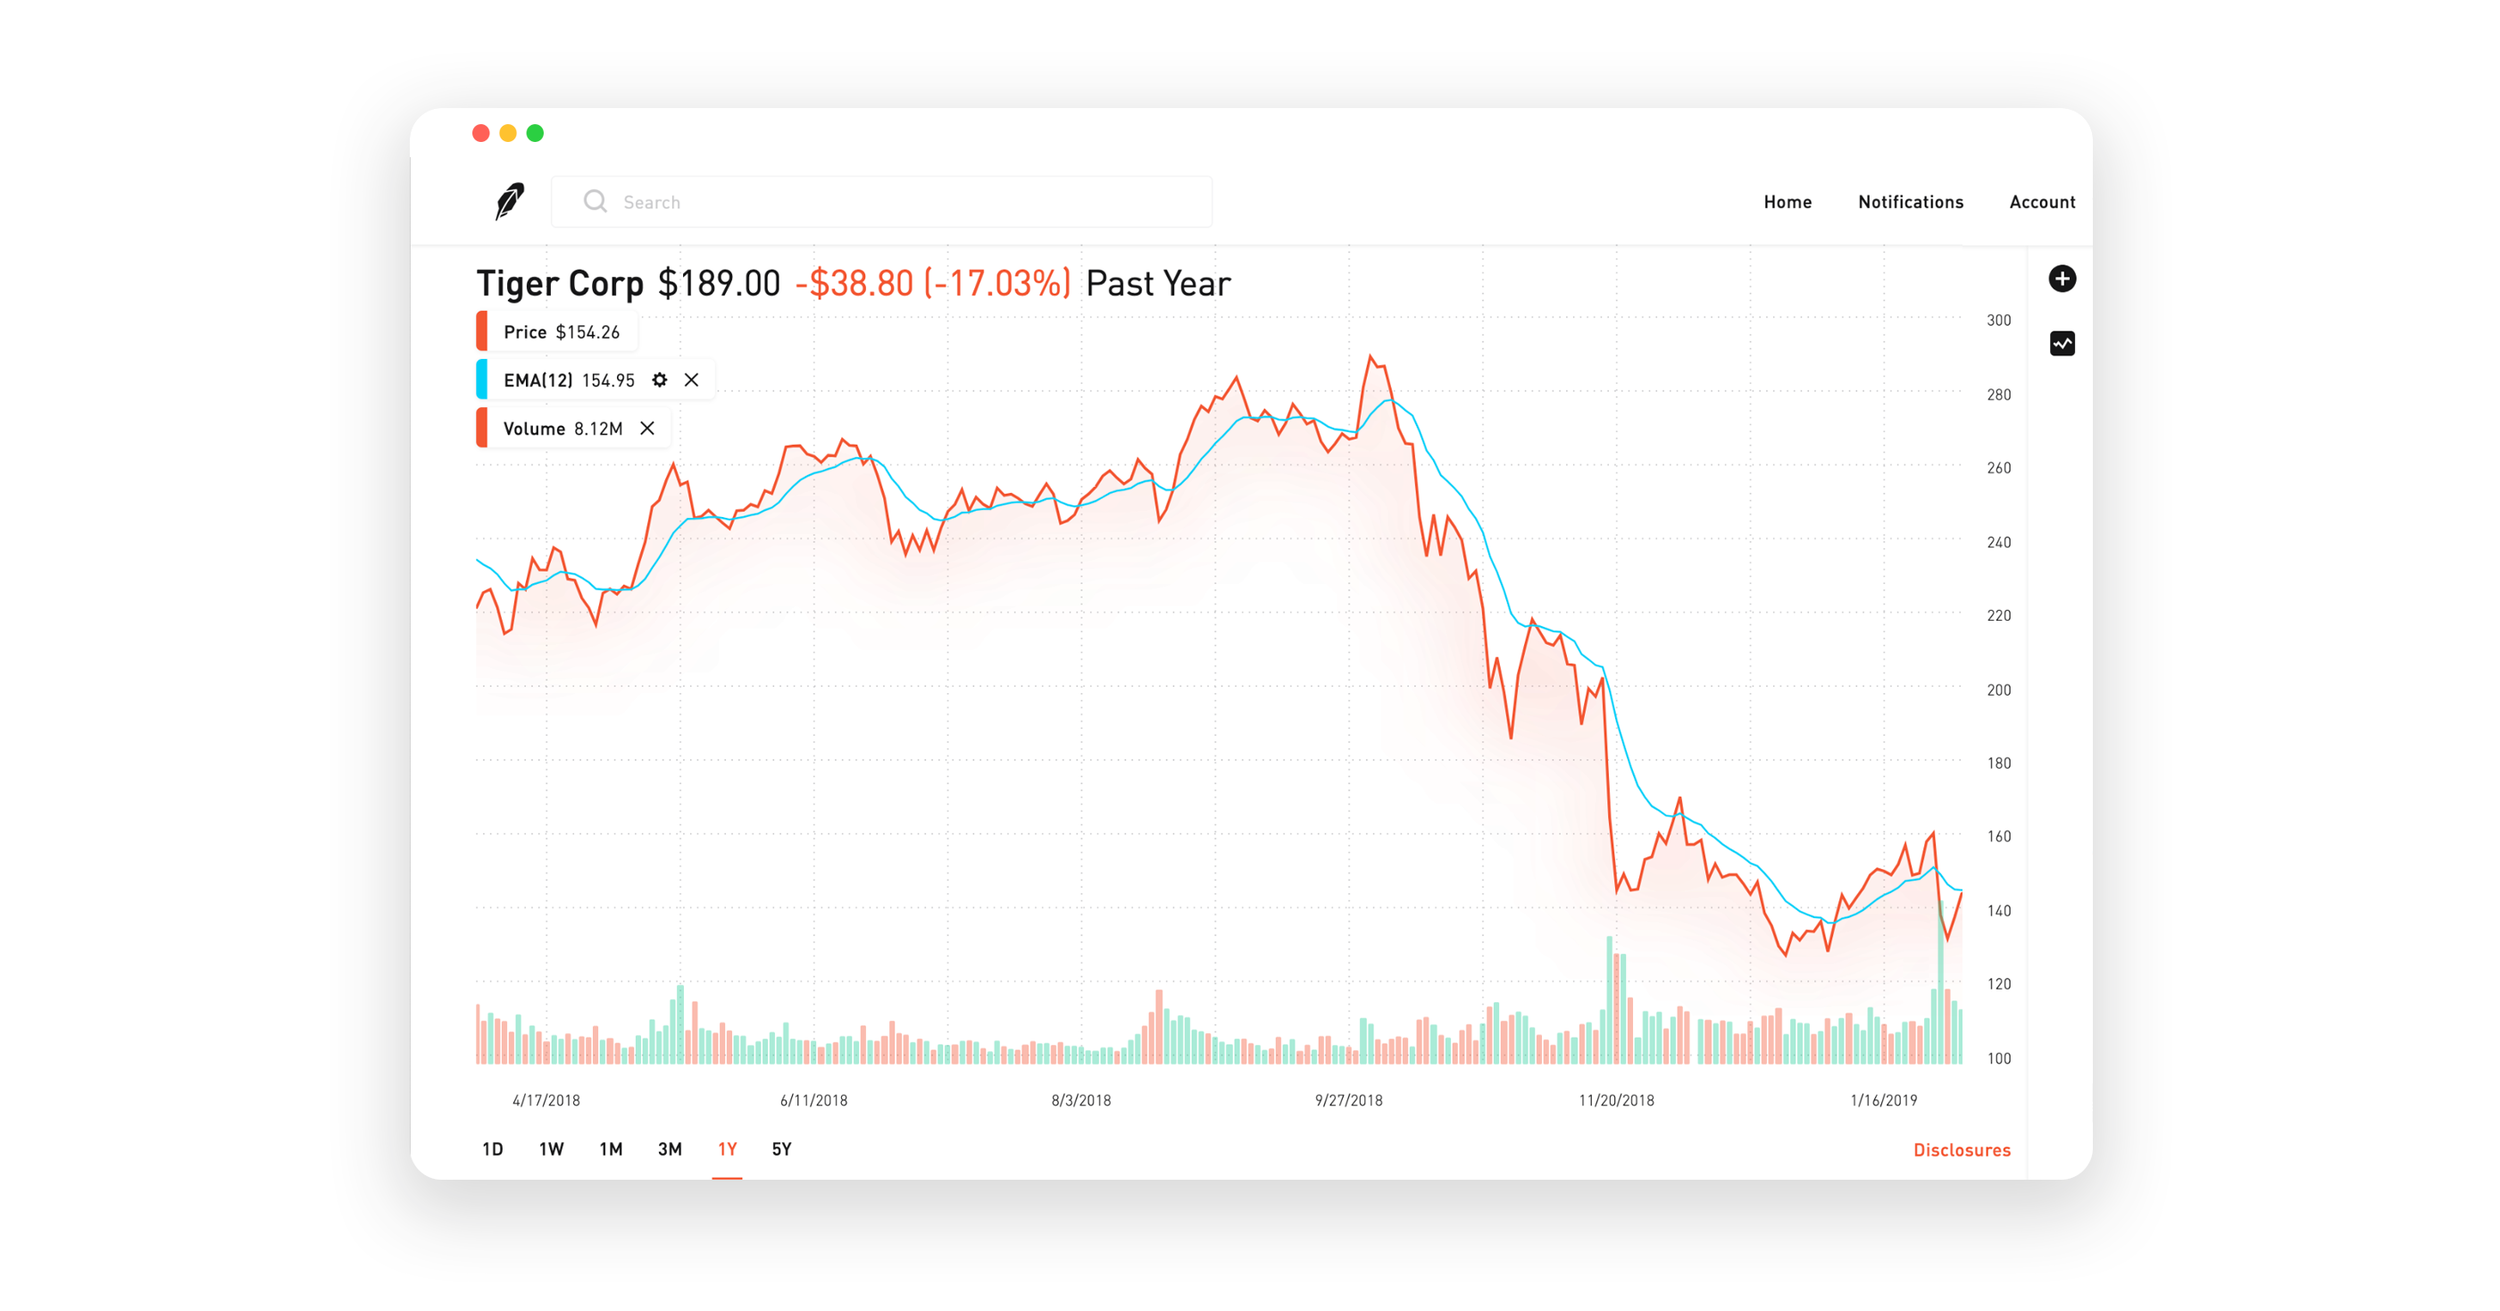
New Charts on Robinhood Web

Indicators and candlestick charts for stocks and cryptocurrency
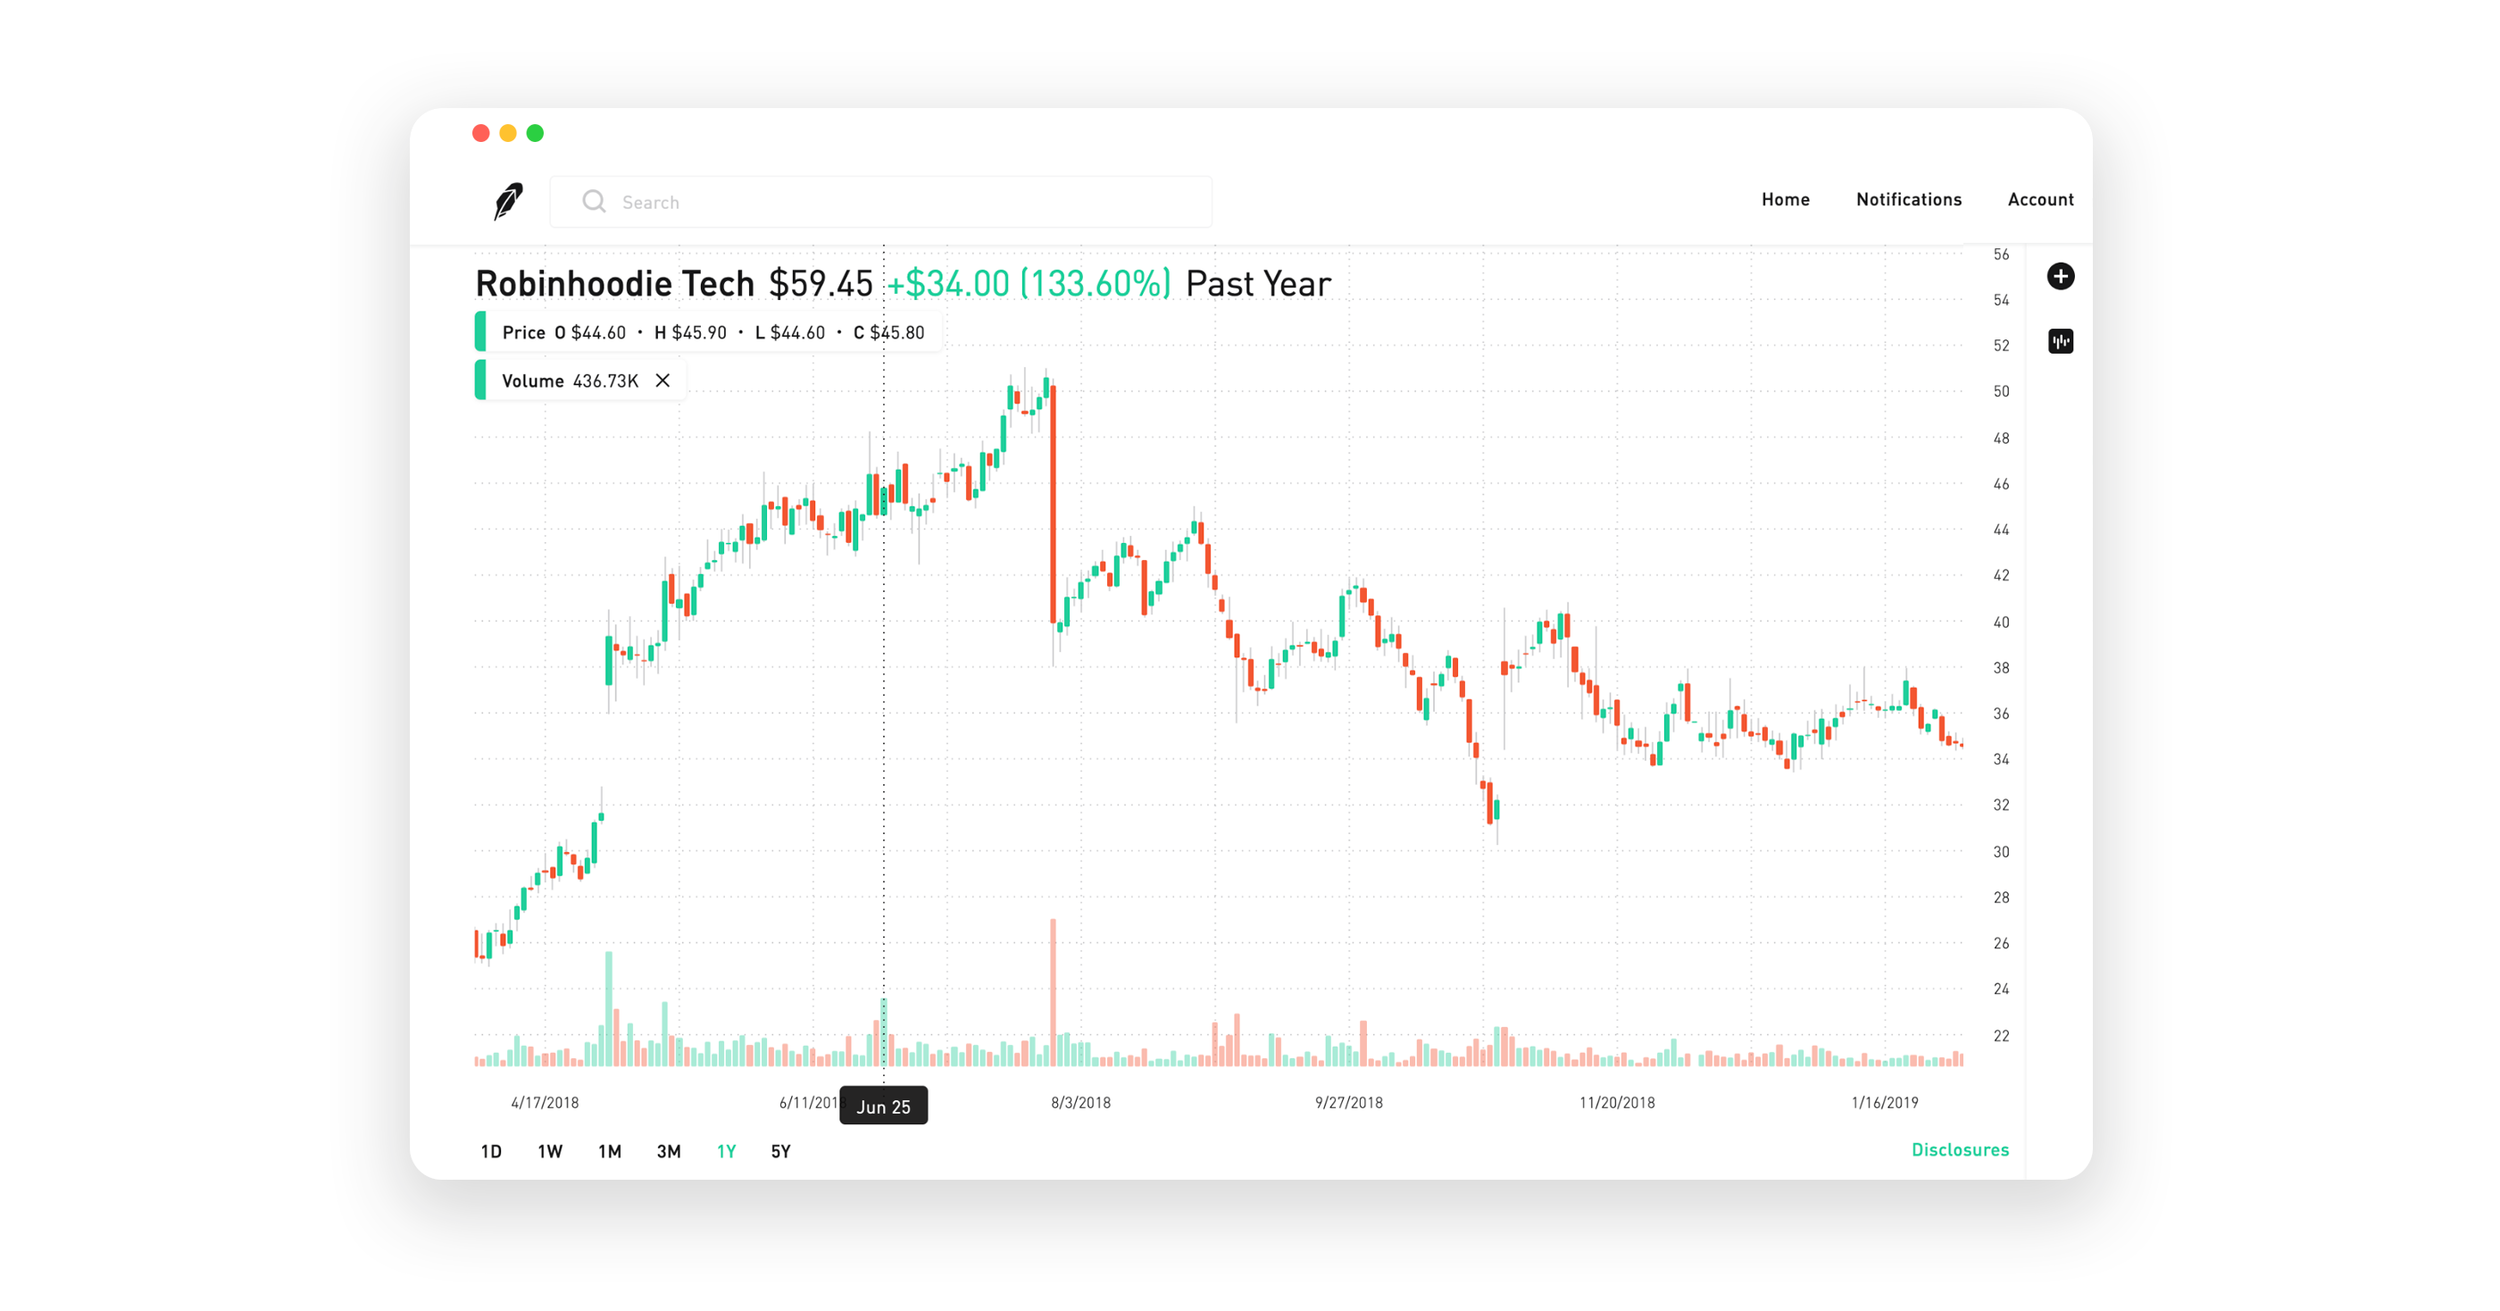
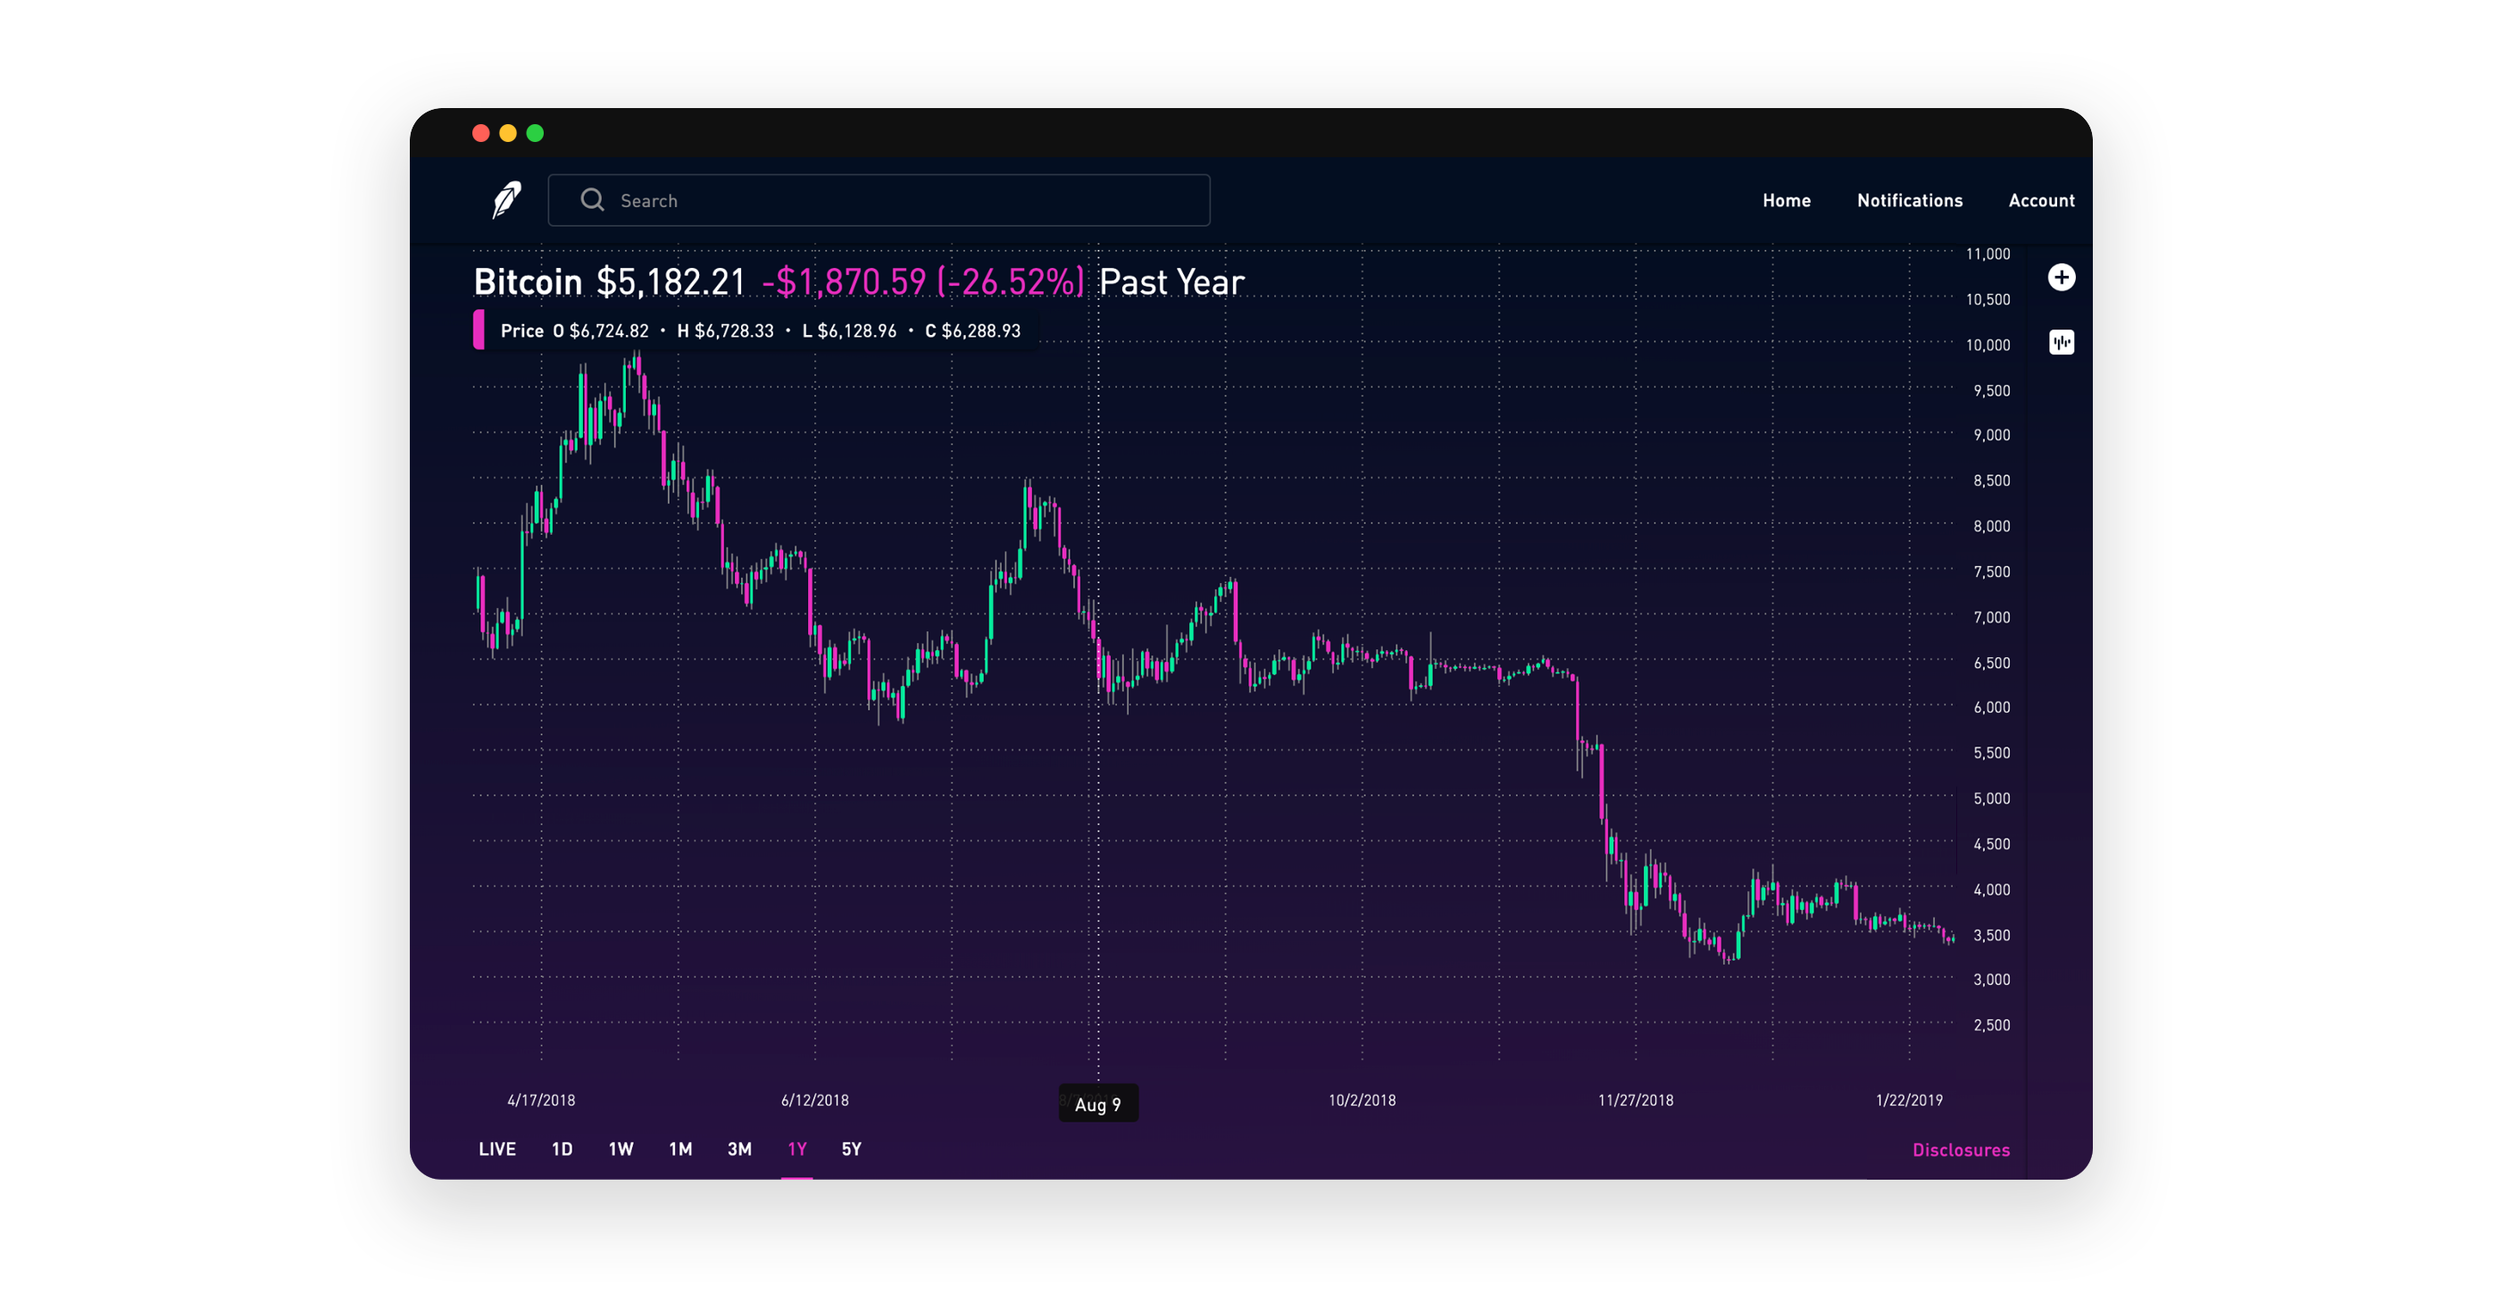
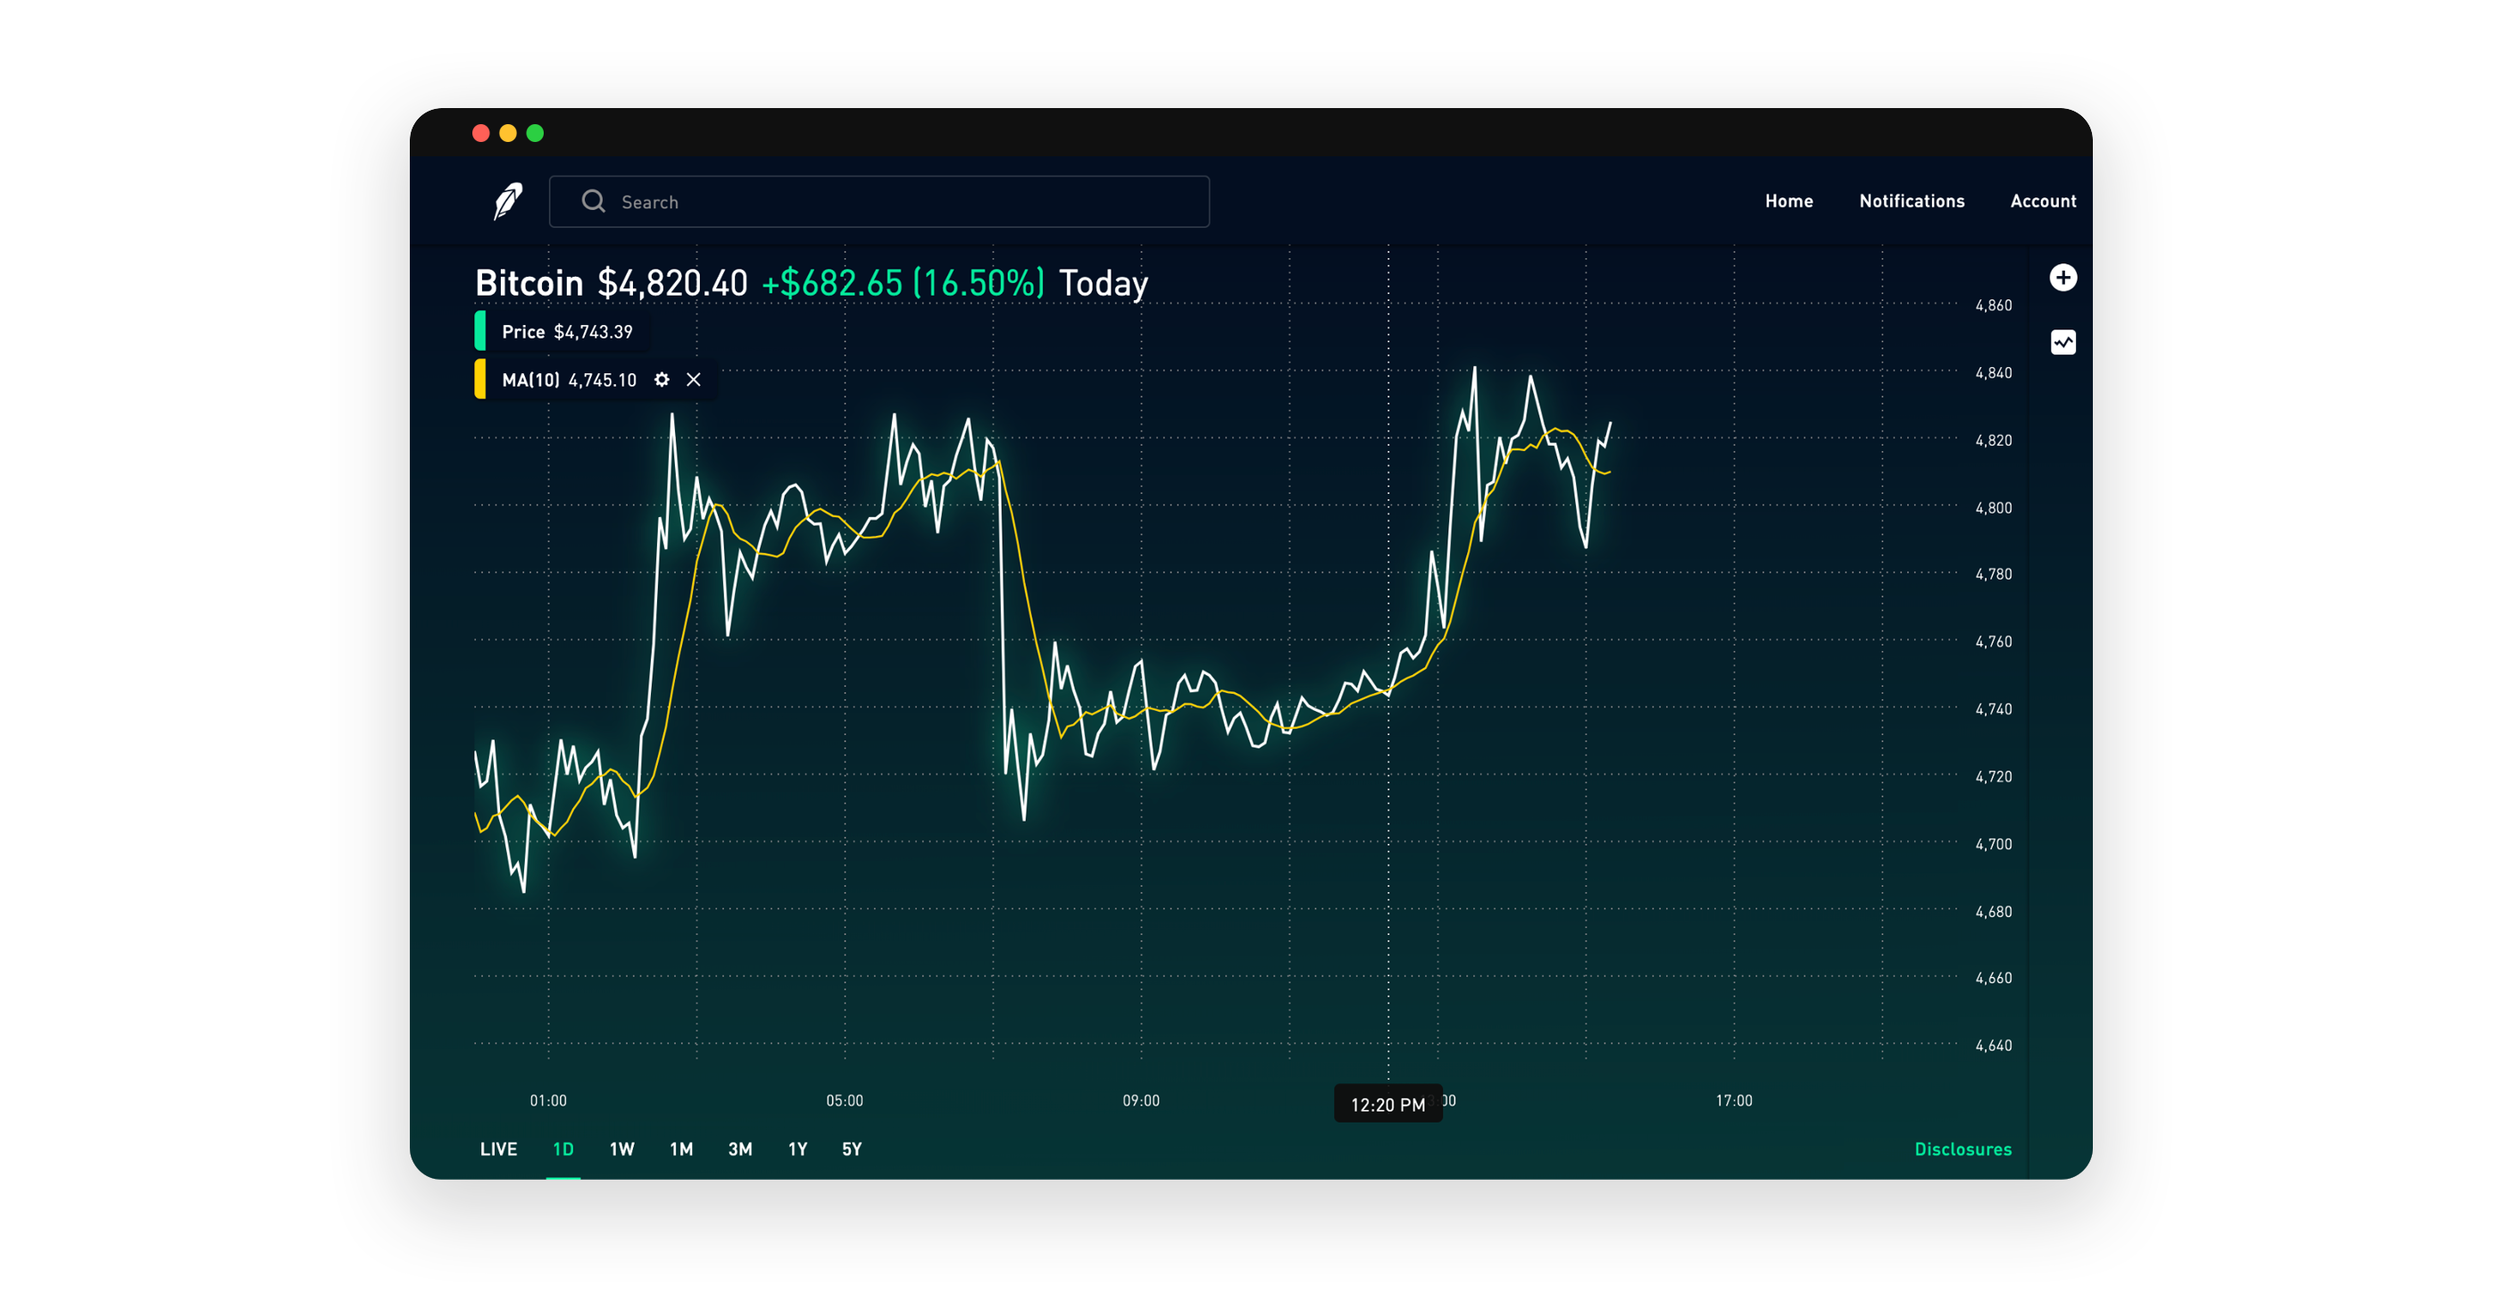
Over the next few weeks, we’re introducing improvements to our charts on Robinhood Web to help you better understand and analyze market trends and moves. You’ll be able to view candlestick charts for stocks and cryptocurrency, and add indicators to stock and crypto charts.
Candlestick Charts
Candlestick charts can help investors better understand how prices move. While a line chart shows you only the close price, each candlestick shows you four pieces of information: the open, high, low, and close price during a certain time period.
Go to any stock or crypto page and click the button near the top right corner of the page to switch between the “Line Chart” and the “Candlestick Chart.” Learn more about candlestick charts here.
Indicators
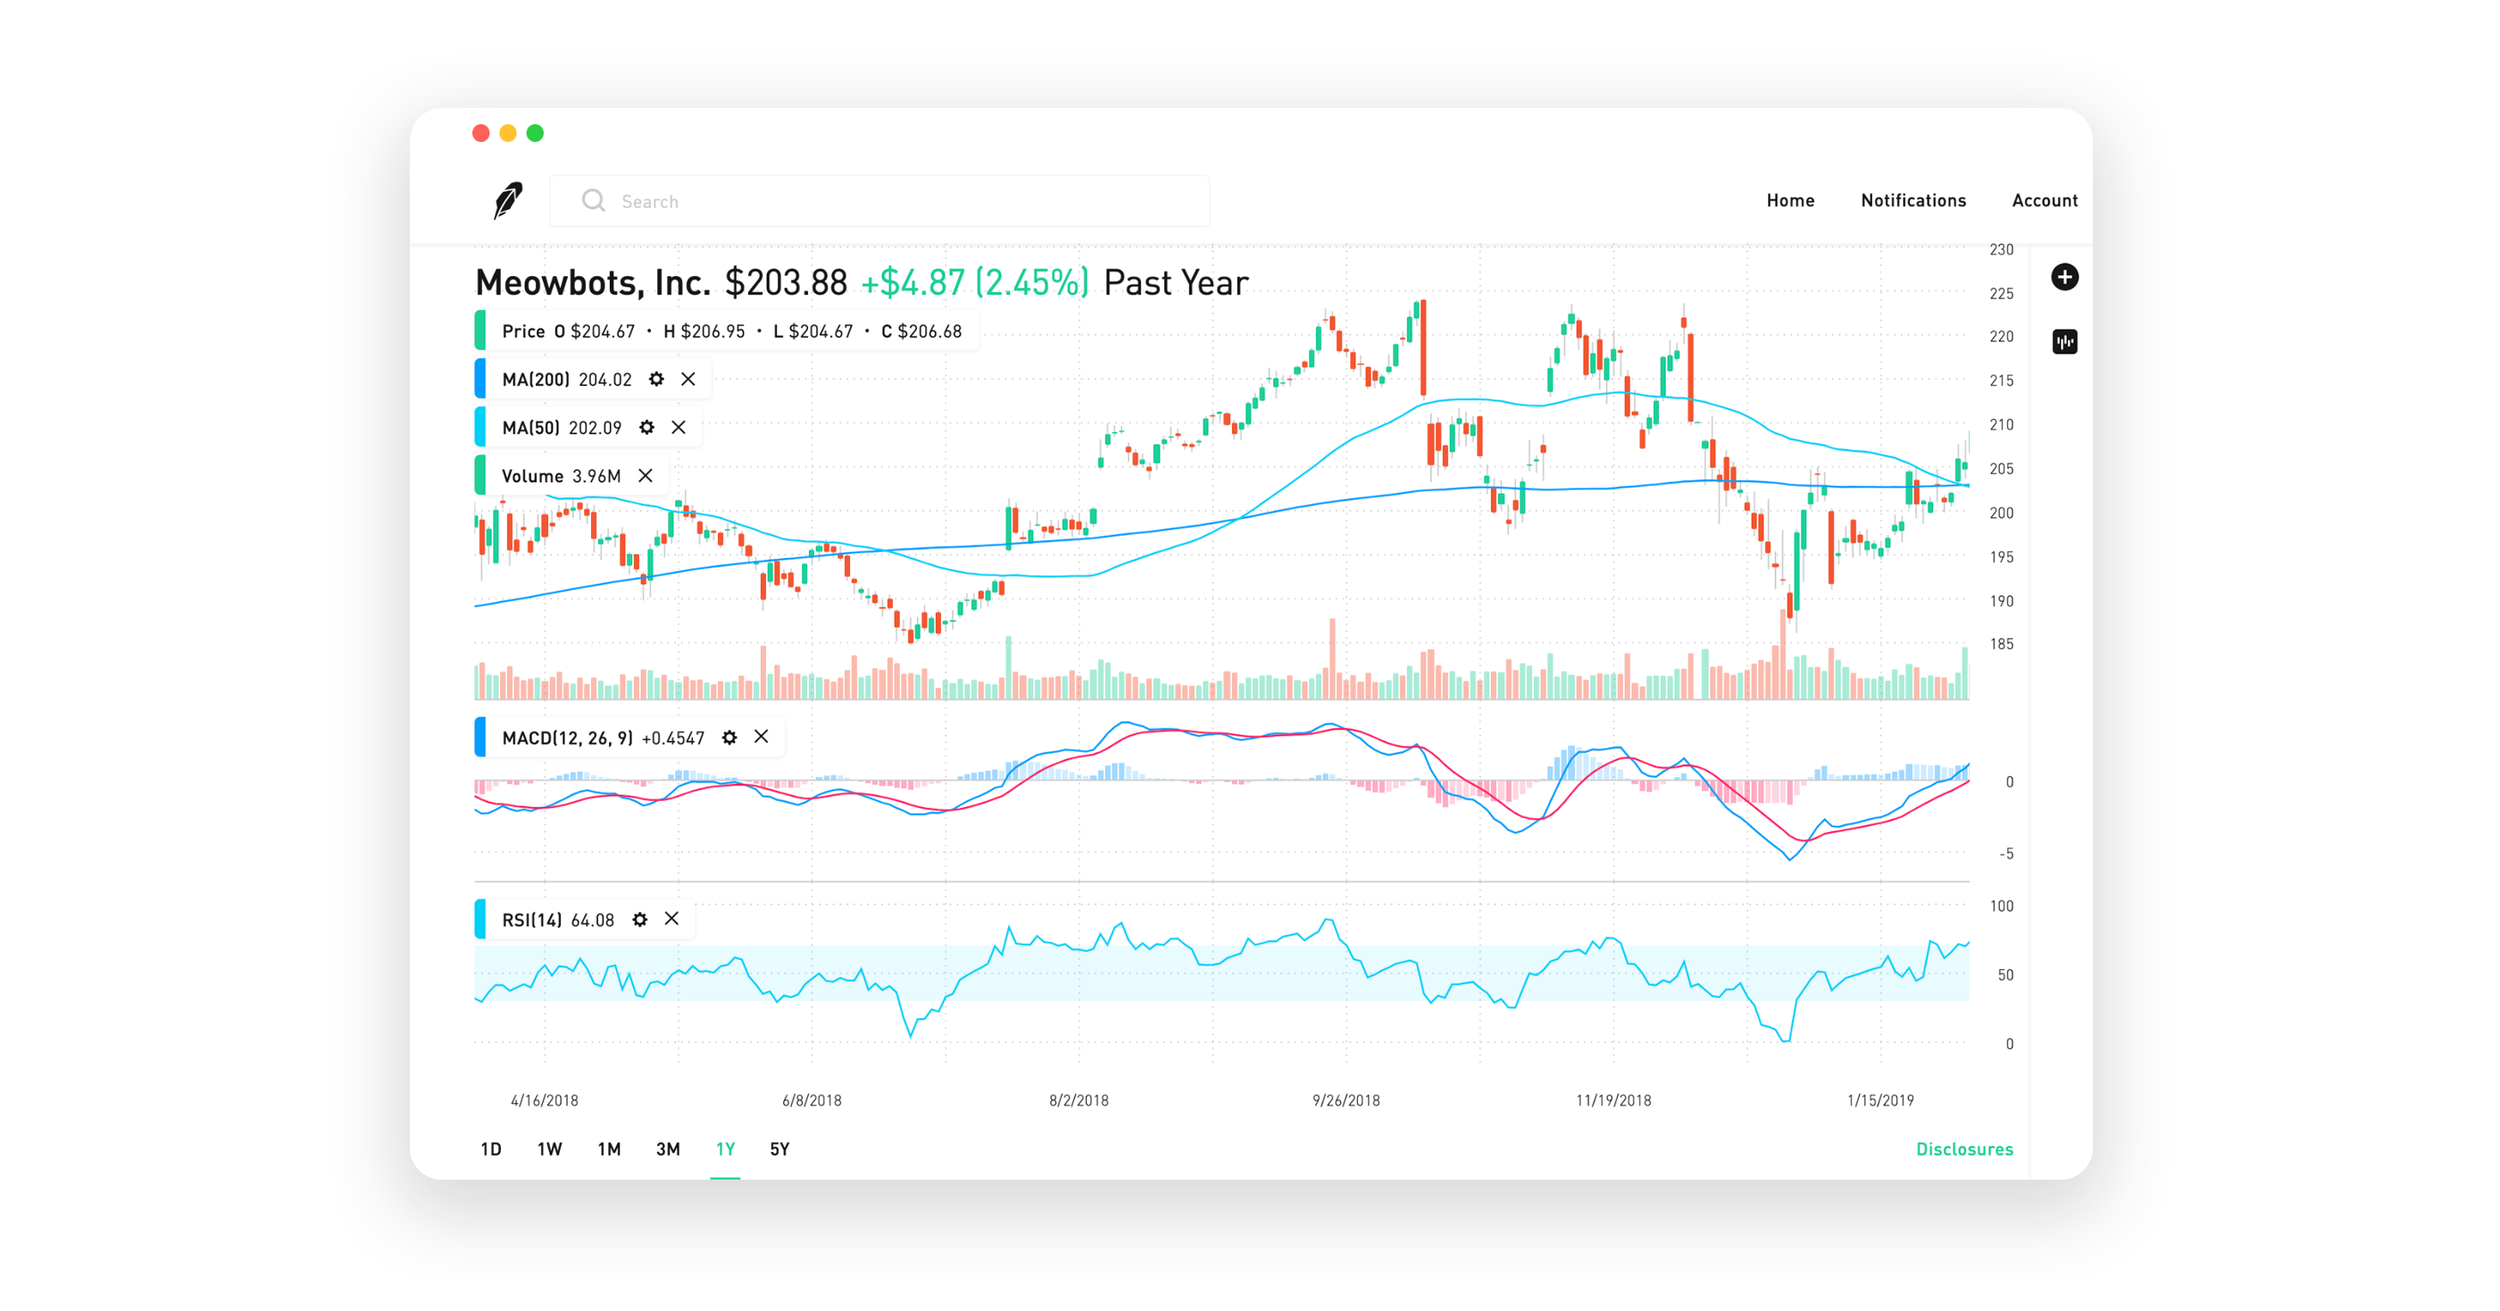
Indicators can help you understand and offer more ways to visualize what’s happening in the market, and are the foundation for various technical trading strategies. Now you can add these five indicators to any stock and crypto charts on Robinhood Web:
- Volume
- Simple Moving Average (SMA)
- Exponential Moving Average (EMA)
- Relative Strength Index (RSI), including Wilder’s Relative Strength Index (Wilder’s RSI)
- Moving Average Convergence Divergence (MACD)
To view an indicator, go to any stock or crypto chart and click the button on the bottom right corner of the chart. The chart will appear in a new tab, and you’ll see an option to add indicators on the top right corner of the page. Learn more about indicators on our help center.
We’re always looking to make Robinhood even more powerful, and your feedback helps us prioritize which features we build first. These tools were among the most frequently requested—we’re excited for you to try them!
